The average shopify conversion rate is only a benchmark. See 2026 Shopify data, measurement caveats, and practical ways to diagnose your store.

Thomas GiraudLinkedIn
Co-founder of FullStack, founder of the CRO agency The Deployer
What does an average tell you about your Shopify store? Less than you might expect if you treat it as a score rather than a reference point. A benchmark is useful for framing a question; your own analytics help you identify where to look. Our Shopify conversion rate optimization resources focus on that practical distinction: a useful next step begins with the customer journey, not a number in isolation.
The average Shopify conversion rate depends on how a study defines conversion, which stores it includes, and when the data was collected. It also reflects differences in product price, customer intent, traffic source, and shopping experience. A store drawing mostly first-time visitors from broad paid campaigns should not expect the same pattern as one with repeat customers and high purchase intent.
One recent Shopify-specific benchmark reports a median conversion rate of 1.3%. Littledata’s study covered 450 Shopify stores connected to Google Analytics 4 through its service, with data from August 10 to November 7, 2026. The Littledata benchmark also places the top 20% at 2.8% or higher and the top 10% at 3.6% or higher. Its cohort required at least 1,000 sessions and 90 purchases during the 90-day period.
Those figures offer a reference point, not a pass or fail threshold. The median means half of the stores in that particular sample were below 1.3% and half were above it. It is not the same as saying every Shopify store should reach 1.3%, or that a store just above the number is necessarily healthy.
Before comparing your store with any Shopify conversion rate benchmark, check the study’s time period, sample, and conversion definition. A cohort made up of stores with a minimum number of purchases excludes some new or low-volume merchants. That can make it a useful comparison for established stores while making it less relevant to a store that has only recently launched.
Even published ecommerce averages can vary because they measure different populations and use different data sources. Shopify’s 2026 ecommerce guidance cites a 1.4% global ecommerce visit-to-purchase rate from Statista for the first quarter of 2026, alongside a 2.66% global average from Dynamic Yield, which benchmarks more than 400 brands. The Shopify ecommerce benchmark overview presents both figures, which should not be read as two estimates of the same Shopify-only sample.
Another source of variation is the statistic itself. A median conversion rate describes the midpoint store, while a mean can be pulled upward by a smaller number of stores with unusually high rates. Reporting a mean, median, or percentile answers a different question, so the headline percentage alone is not enough to reproduce a comparison.
Measurement choices matter too. One report may count sessions that end in a purchase; another may use visitors, transactions, or a platform-specific conversion event. A difference in the denominator or reporting window can change the result without any change in customer behavior. Compare figures only when their definitions and periods are reasonably aligned.
A storewide benchmark can hide meaningful differences between the people arriving at your store. A product with a low price and straightforward use case may attract shoppers who decide quickly. A higher-priced product that requires more research may have a longer consideration period. Even stores in the same industry can have different product mixes, price points, customer familiarity, and purchase cycles.
Traffic source is another important lens. A shopper arriving from a branded search or an email to a past customer has different context from someone seeing a product for the first time in a broad social campaign. If you want to compare your acquisition mix, our conversion rate by acquisition channel calculator gives you a way to examine channel-level results rather than relying on one blended figure.
For a useful Shopify conversion rate by industry comparison, look for a benchmark that names its categories and explains its sample. If a report does not provide those details, avoid treating an industry label as a precise match for your store. Your assortment, average order value, brand recognition, and share of new customers can all differ from the stores included in that category.
Segmenting does not mean creating so many slices that each one contains too little data to interpret. Start with a few meaningful groups, such as paid versus organic traffic, mobile versus desktop, and new versus returning visitors. Check whether a difference persists across a consistent time window before deciding that it reflects a real change.
For a session-based purchase rate, divide sessions that ended in a purchase by total sessions for the same period, then multiply by 100. Keep the denominator, conversion event, and date range consistent when you compare periods or channels. Your session-based conversion rate is easier to interpret when you also inspect the steps before purchase, such as product views, add-to-cart activity, checkout starts, and completed orders.
If product views are strong but add-to-cart activity is weak, inspect the product page and the traffic reaching it. If shoppers add products to their carts but few proceed to checkout, review the cart experience and the clarity of shipping costs or offers. If checkout starts are healthy but purchases fall away, examine payment options, unexpected costs, and other potential checkout friction. These are diagnostic leads, not proof of a single cause.
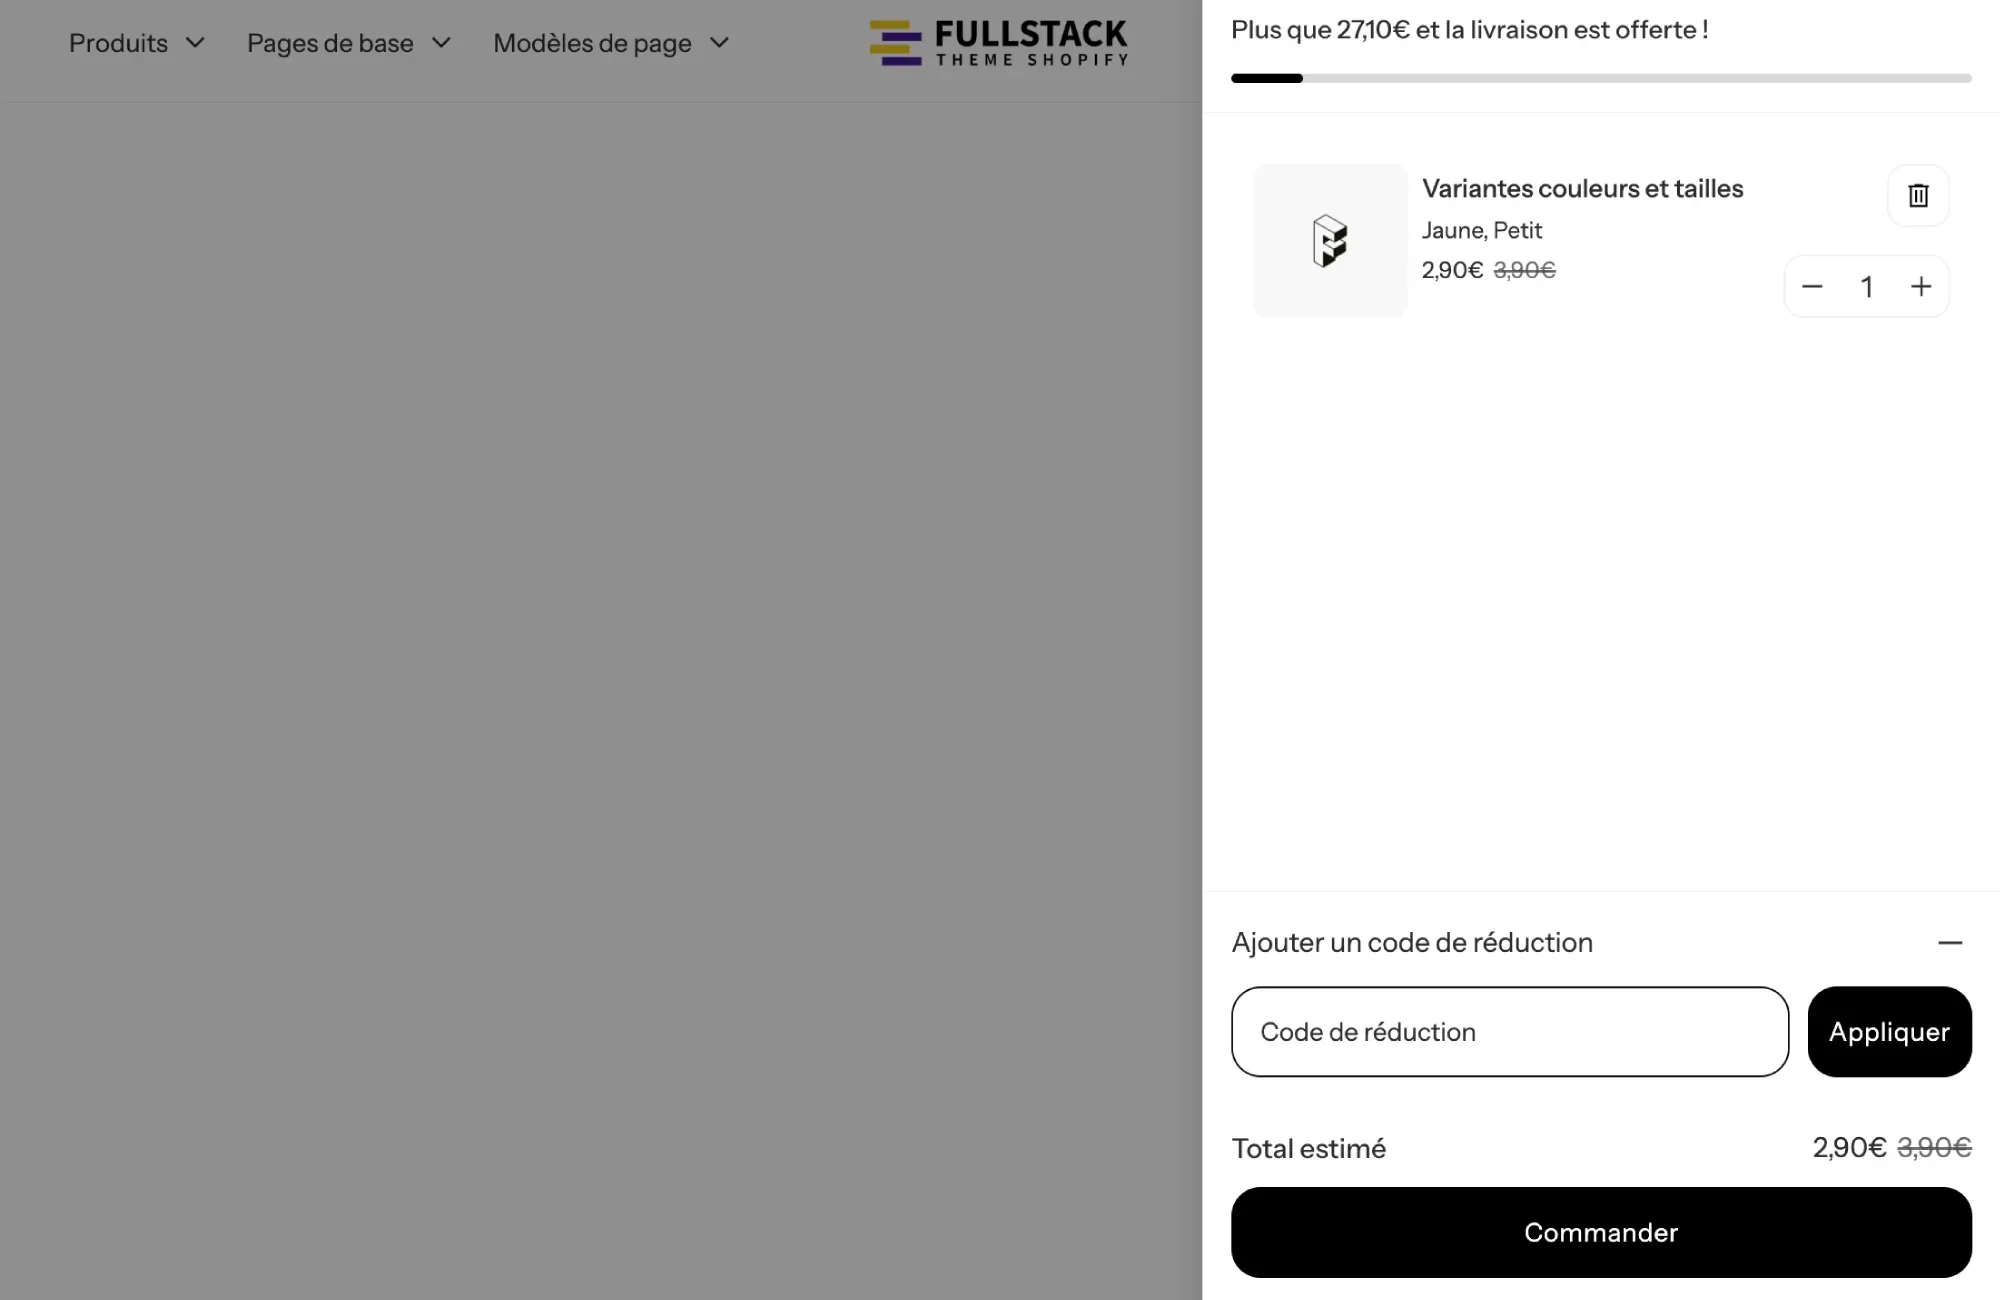
Compare funnel steps by device and acquisition channel where the data supports it. A storewide rate can conceal a weaker mobile experience or a traffic source that brings in visitors with little purchase intent. When investigating checkout specifically, our Shopify checkout abandonment rate calculator can help frame the gap between starting and completing checkout.
A useful example is a product page that receives many visits but few add-to-carts. Instead of changing several elements at once, check whether the offer is clear, product details answer likely questions, and the purchase action is easy to find on a phone. A page-level example can provide ideas for what to inspect, but its result should not be treated as a benchmark for your store.
Start by locating the step where the largest meaningful drop-off occurs. Then form a specific explanation to test, such as whether product information is hard to scan on mobile or whether the checkout total is clear before the final step. A focused question is more useful than a broad instruction to “improve conversions,” because it gives you a change to make and a result to measure.
Keep the measurement window and comparison group consistent. If you change a product page, compare that page with its own prior performance or a suitable test group, rather than comparing it with a storewide average. Avoid changing multiple major elements at once if you need to understand which change affected the result. Where possible, use an A/B testing tool and make sure the test has enough data to support a decision.
A small 2026 report from DTC Pages illustrates why sample context matters. Its first-party analysis of 18 stores in its portfolio reported a 2.56% average conversion rate for July through September 2026, alongside a 6.27% average add-to-cart rate. The DTC Pages benchmark report describes a selected portfolio, so its figures are useful as an example of one group’s results, not as a universal Shopify average.
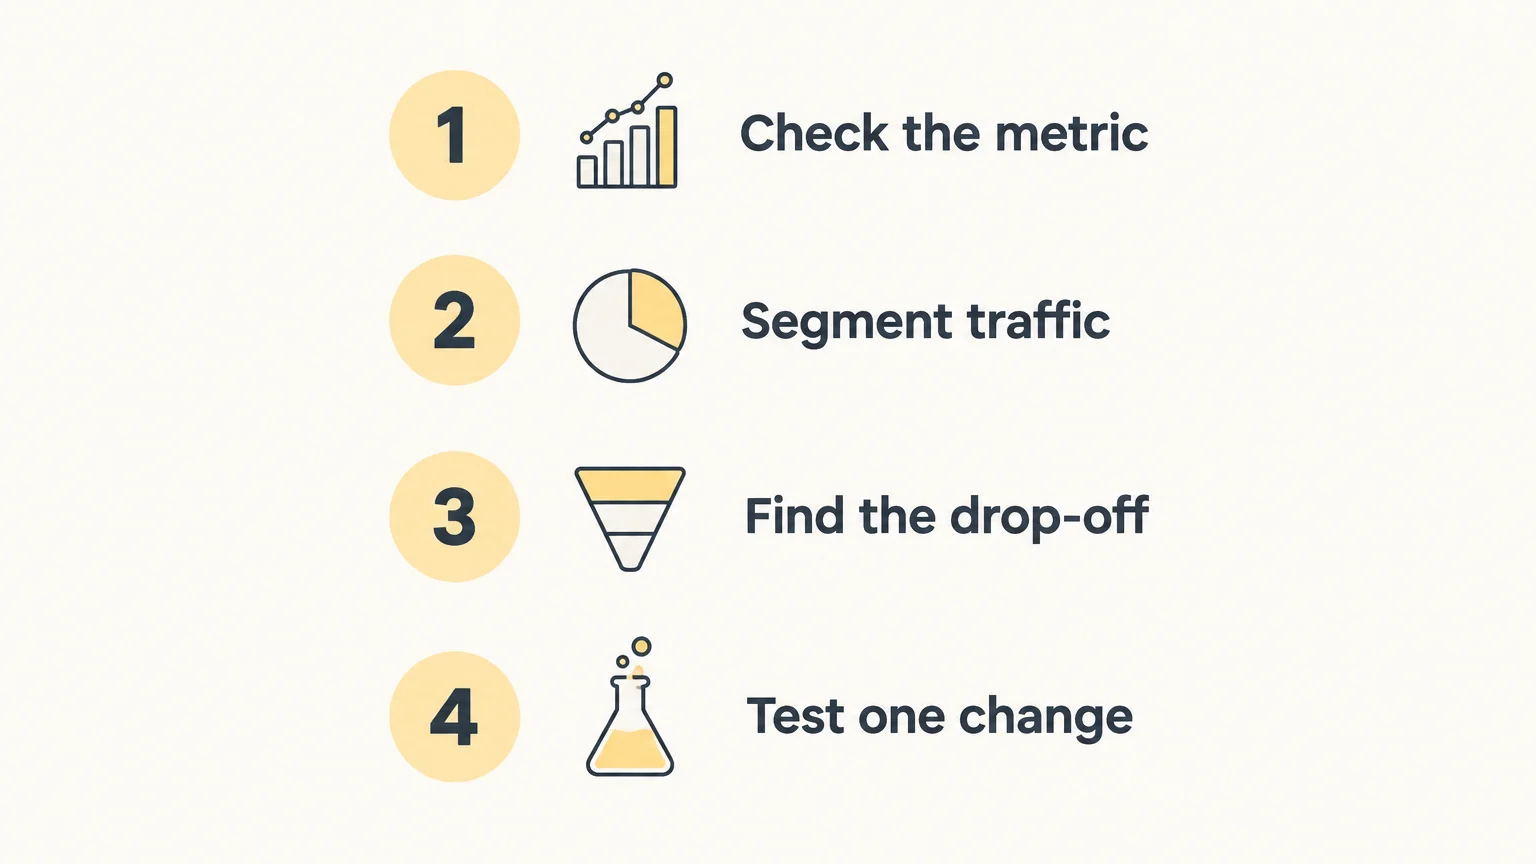
Use a short review sequence to keep the work actionable: confirm the metric, segment the audience, identify the funnel step, and test one focused change. Recheck the result over a period that gives you enough relevant data, and record what changed. That gives you a store-specific learning process instead of a target based on an unrelated sample.
Your theme is part of the shopping experience, but a theme choice cannot account for every source of variation in a conversion rate. Product-market fit, offer clarity, traffic quality, pricing, and customer trust all matter. A useful storefront foundation gives you ways to structure pages and offers, while analytics and testing help you decide what to change.
Our FullStack theme is built from Shopify CRO experience developed by the team behind The Deployer. That team brings seven years of e-commerce experience, more than 150 store redesigns, and hundreds of A/B tests; dozens of winning tests became theme options. This is relevant background for how the theme’s sections and features were developed, not a promise of a particular result for an individual store. For merchants evaluating their approach, our article on why CRO matters for Shopify stores offers additional context.
When assessing a theme, consider whether it lets you present product details clearly, build relevant landing pages, and make changes without adding unnecessary complexity. Those capabilities can make it easier to carry out your own analysis and testing. They do not replace a consistent measurement setup or prove that any individual design change will increase conversion.
The average Shopify conversion rate is a starting point for a question, not an answer about your store. Use current, clearly defined benchmarks for context, then compare your own results across consistent periods, customer groups, and funnel steps. Focus on the point where shoppers drop off, make one well-defined change, and measure what happens before choosing the next step.
Once you know which part of the shopping journey needs attention, your theme should give you a practical way to make and evaluate storefront changes. Our CRO-driven FullStack theme includes native sections and tools for shaping product pages, offers, navigation, and cart experiences in Shopify’s theme editor.
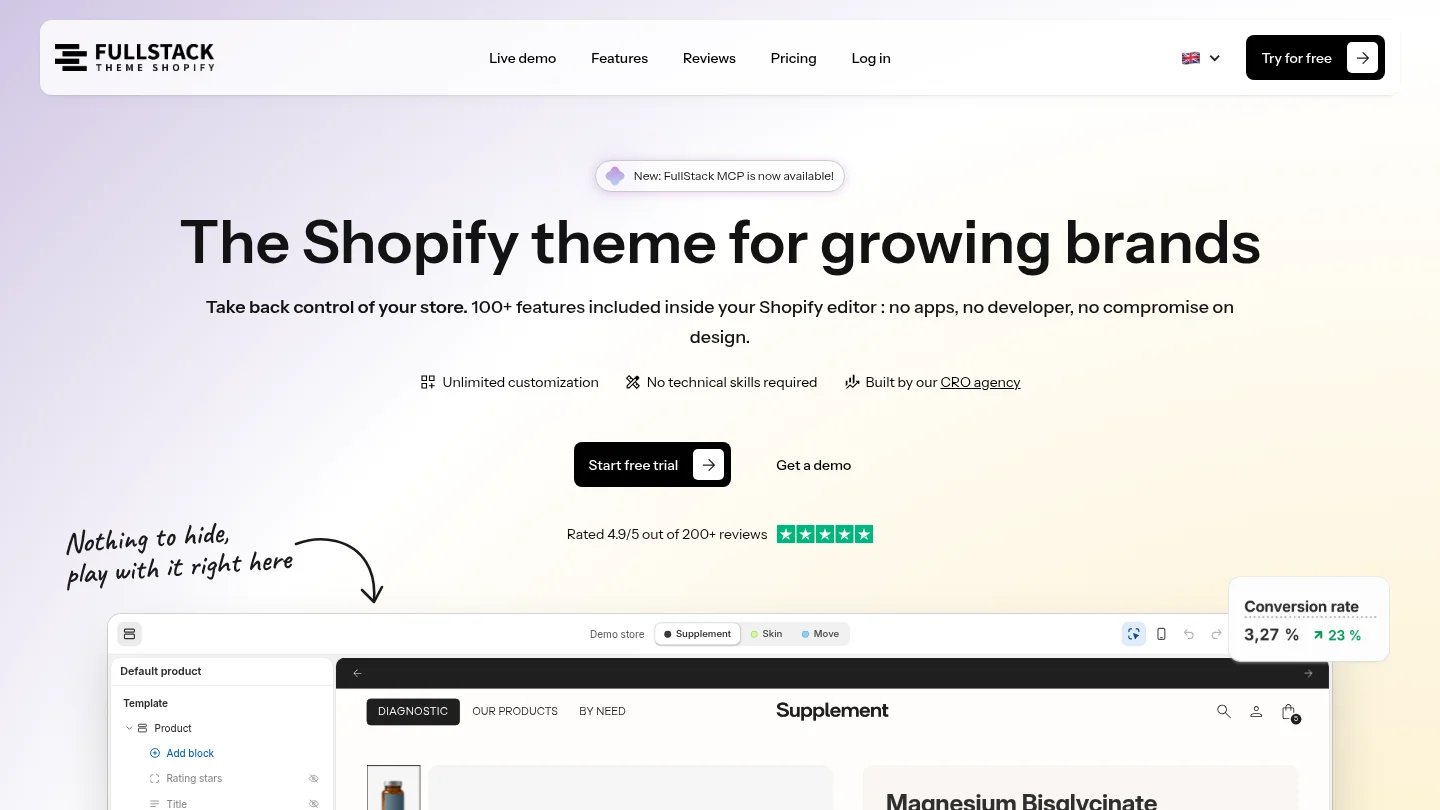
The FullStack theme includes more than 100 native features, 12 one-click page templates, training, updates, and support every day, in every language. You can try it free for 14 days; a credit card is required, and you can cancel during the trial without being charged. Explore Shopify theme features for improving store performance.
There is no single rate that is good for every store. Compare your performance with a relevant benchmark, then look at your own trend and funnel to understand where improvement is most needed.
Reports can use different conversion definitions, date ranges, samples, and analytics tools. Check the denominator and study population before comparing the percentages.
Industry can add context, but it does not make two stores directly comparable. Also consider product price, traffic source, customer mix, and purchase cycle.
Use the same denominator as the benchmark you are comparing against. For your own trend, keep the definition consistent across the periods you review.
A theme shapes how shoppers encounter products, offers, and checkout, but it does not determine the outcome by itself. Our FullStack theme provides native storefront features that merchants can use as they analyze and test their customer experience.

The oral care brand migrates to a technical foundation fully controlled in-house. Fewer apps, more velocity, and a storefront that finally matches the brand's image.
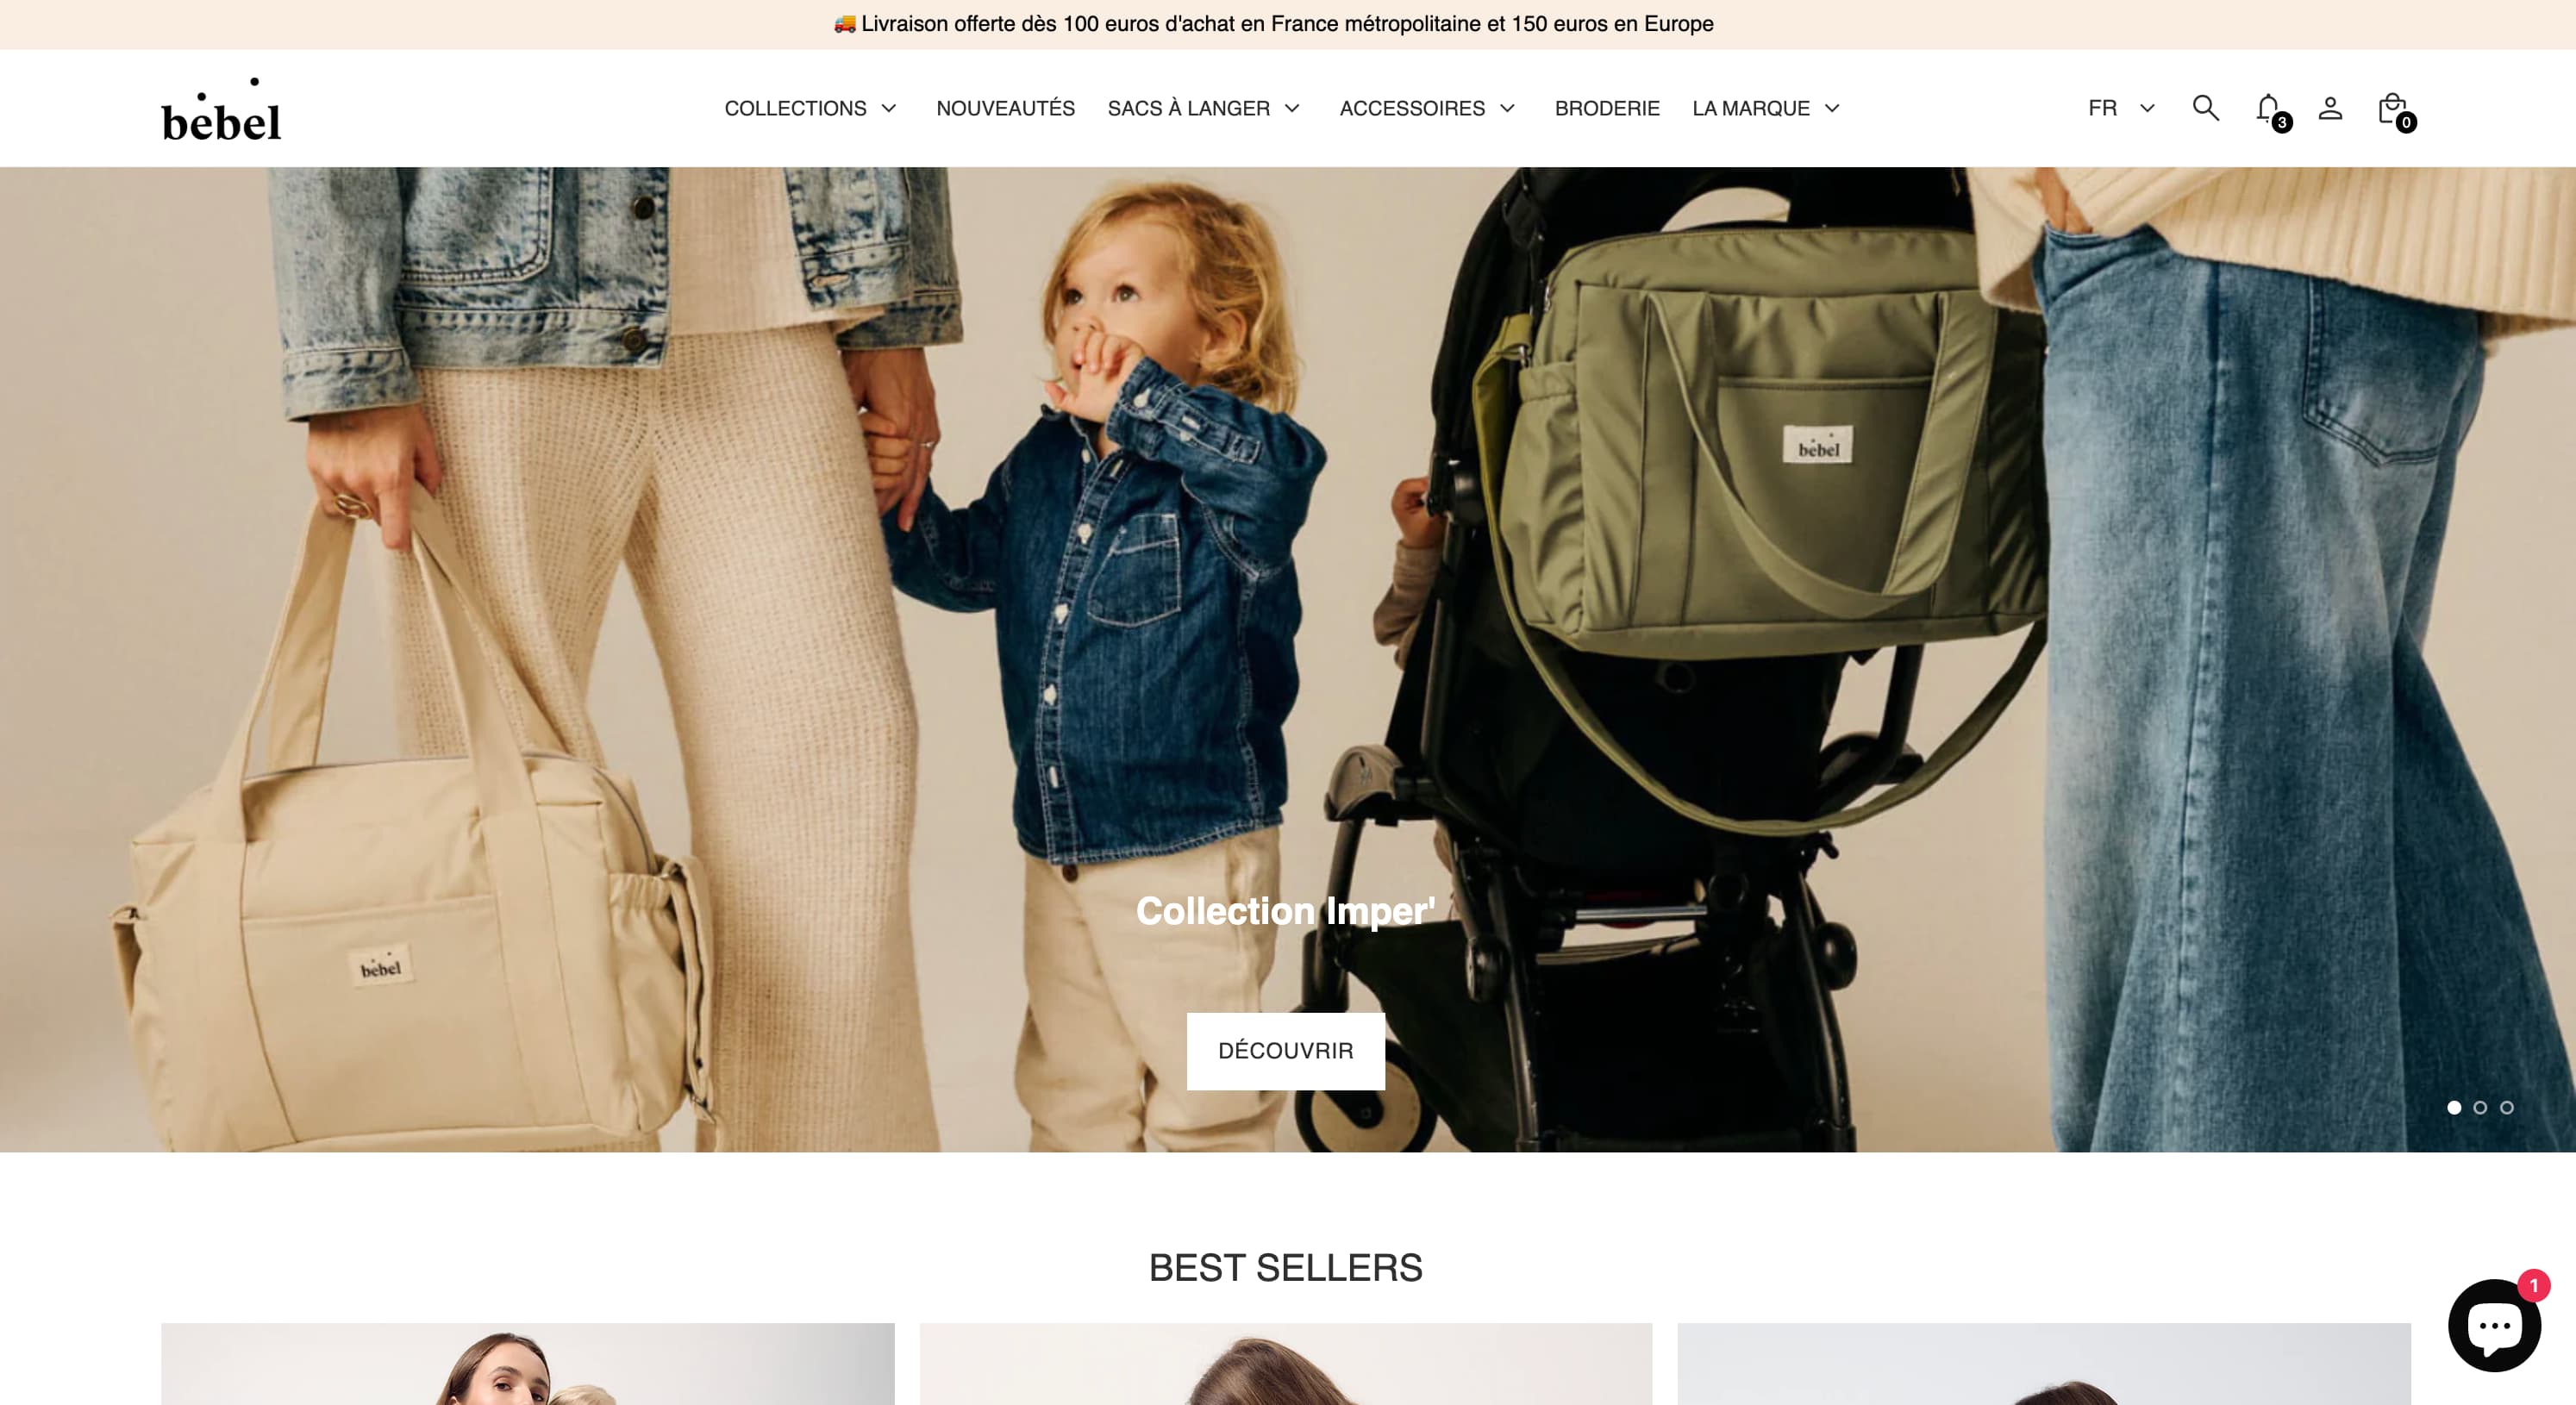
Changing bags, sleep sacks, Oeko-Tex double gauze — a like-for-like rebuild of the made-in-France baby care store on Theme FullStack, delivered by The Deployer.
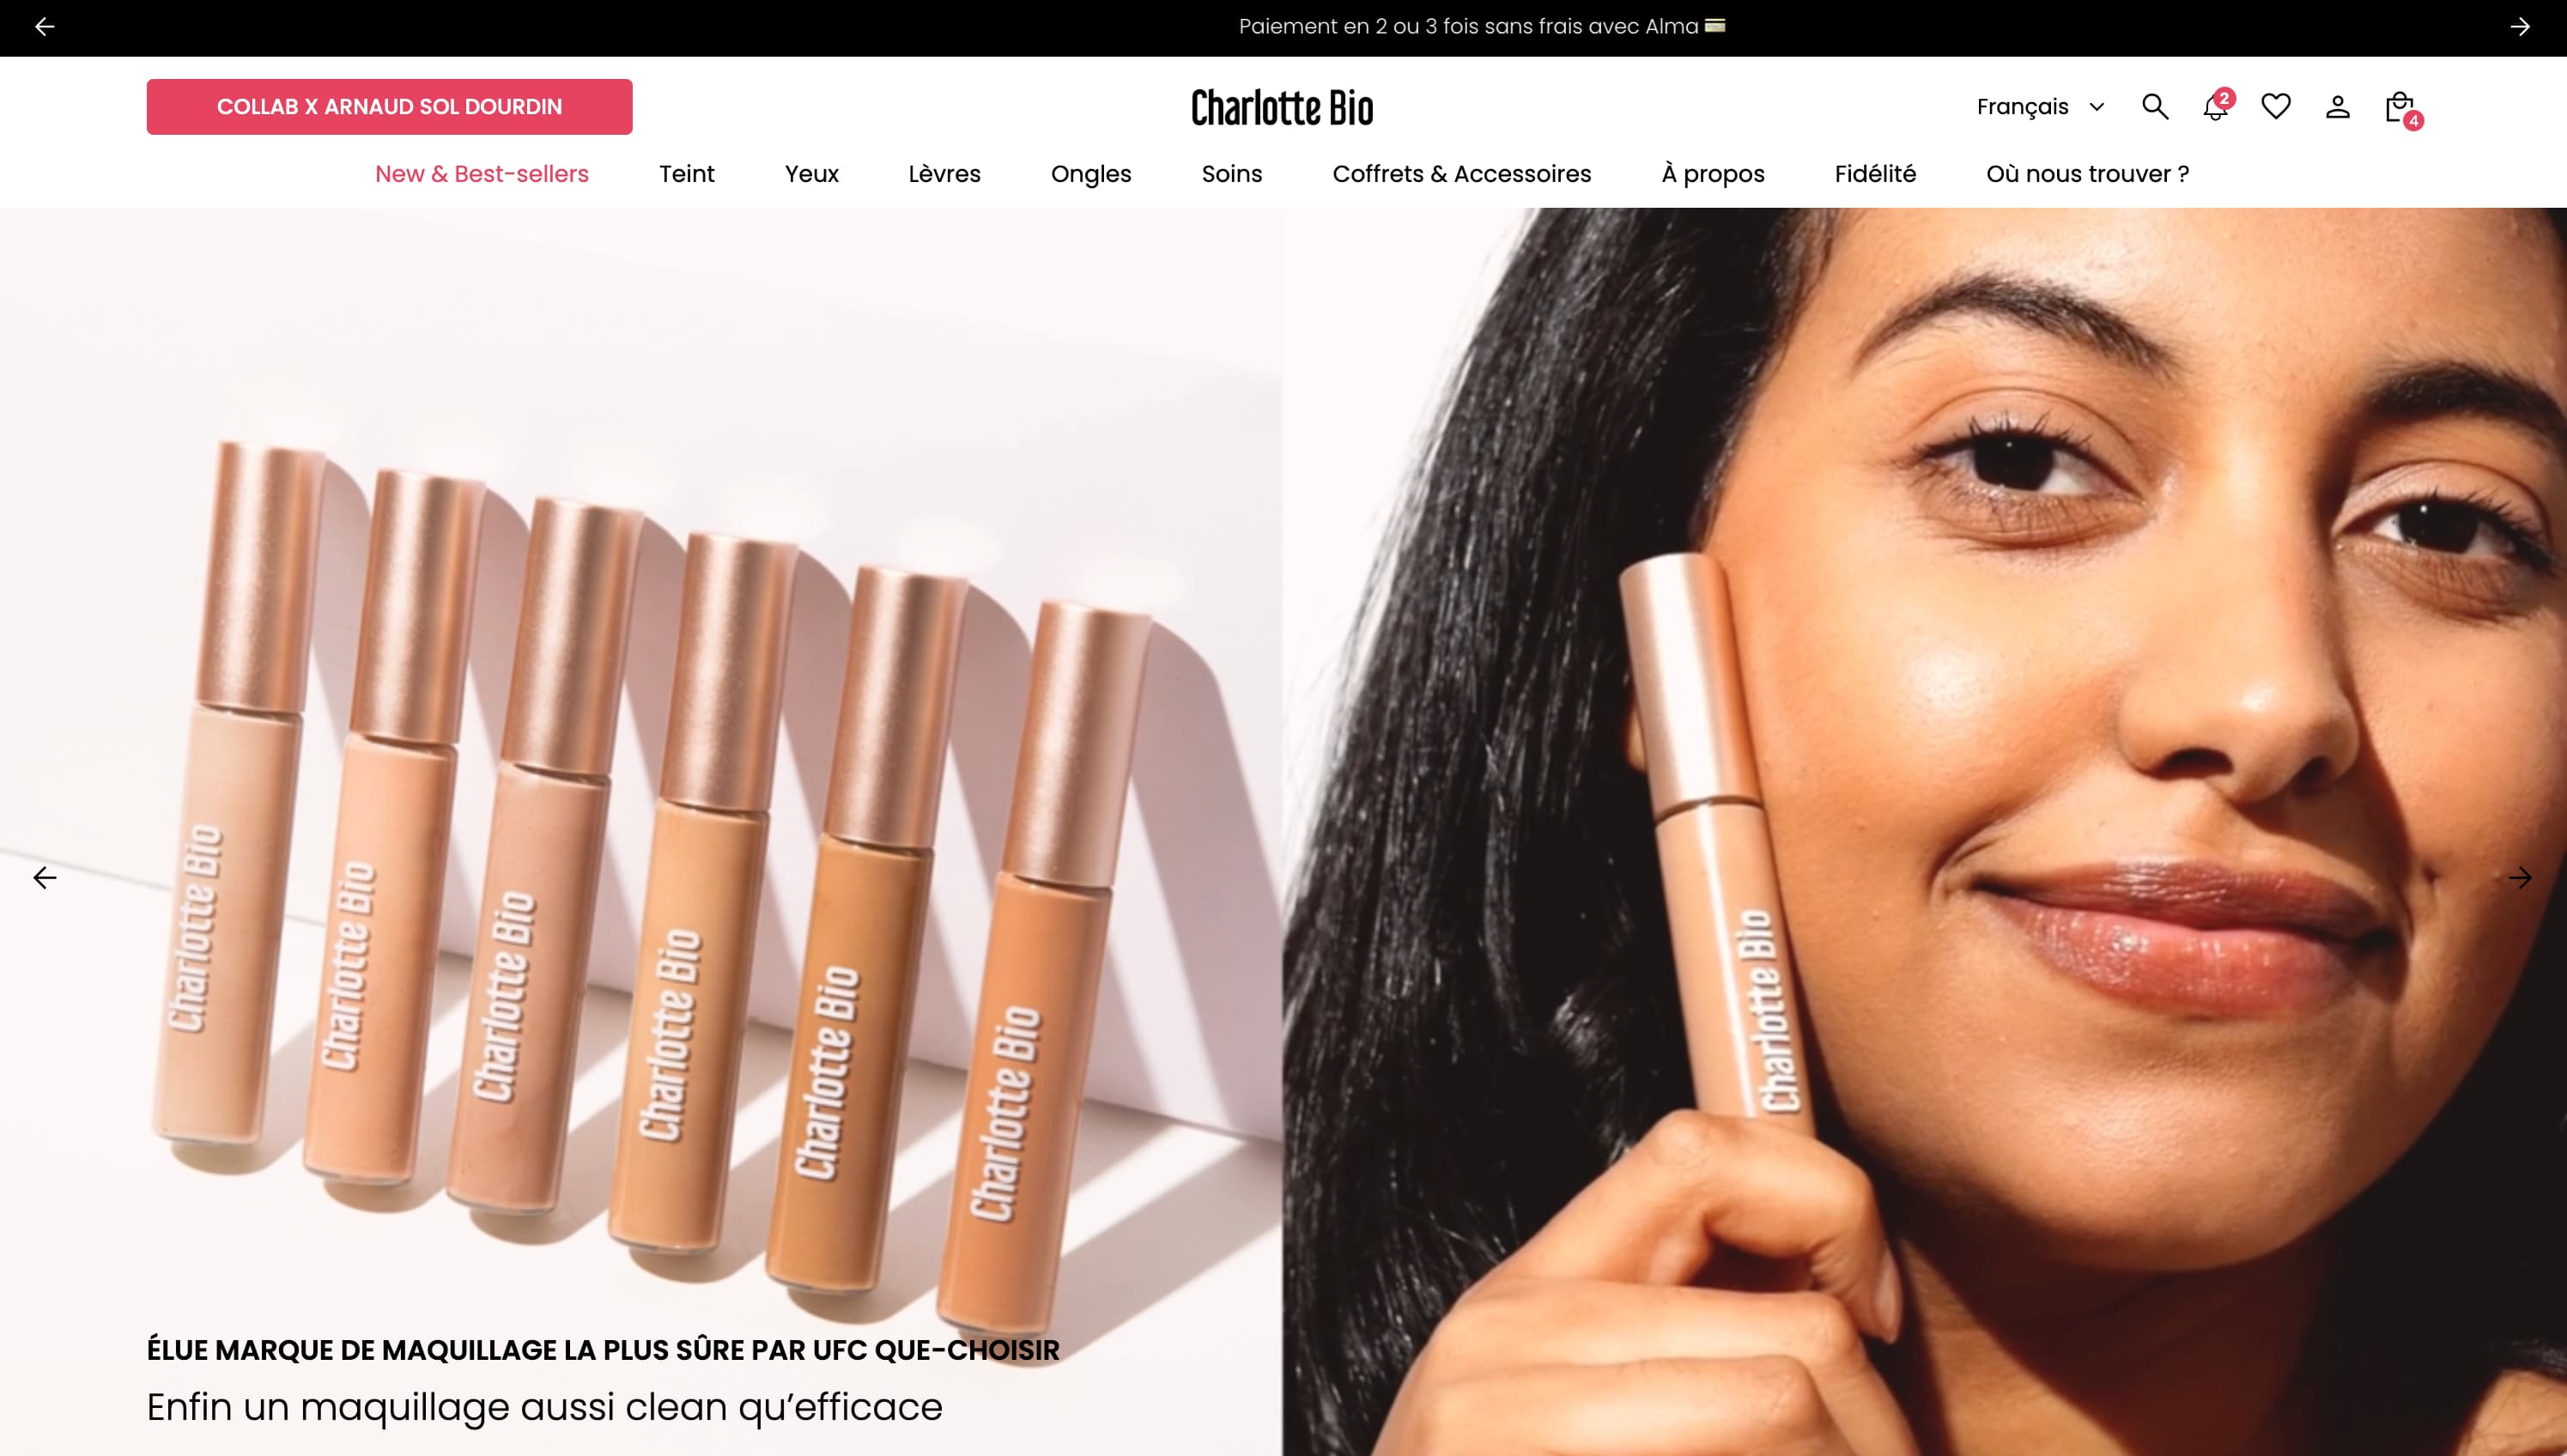
Visual mega menu, custom pack builder, FR/EN/ES internationalization, cart cross-sell — a full redesign on Theme FullStack executed by The Deployer.
Rated 4.9/5 out of 200+ reviews



Rated 4.9/5 out of 200+ reviews